
Race statistics & analysis
See what really happened this year, before you plan the next one
When the race is over, you are left with impressions: the water station was swamped mid-morning, a lot of medals were left over. When it is time to order stock or talk to a sponsor for next year, there is no number to quote.
The data is all in the results already. But a simple answer, like when finishers peaked or what share of entrants actually ran, needs someone to build a spreadsheet, and nobody gets round to it. So next year is planned on impressions again.
At events we time, you and your team open these numbers yourselves, straight from your own results: no-shows, the finish-line peak and the times for each distance, with nobody building a summary file.
What this service does for you
- 1
Open it and see the whole event on one page
Starters by distance, down to gender and age group, laid out so the whole event can be compared at a glance. You can see immediately which distance is the event’s core and which categories have enough runners to deserve their own prizes.
- 2
Find out how many entrants actually ran
Split into finishers, withdrawals, disqualifications and no-shows. The no-show number is the one organizers use most, because it is the gap between what you ordered and what was actually used.
- 3
See when finishers arrived thickest
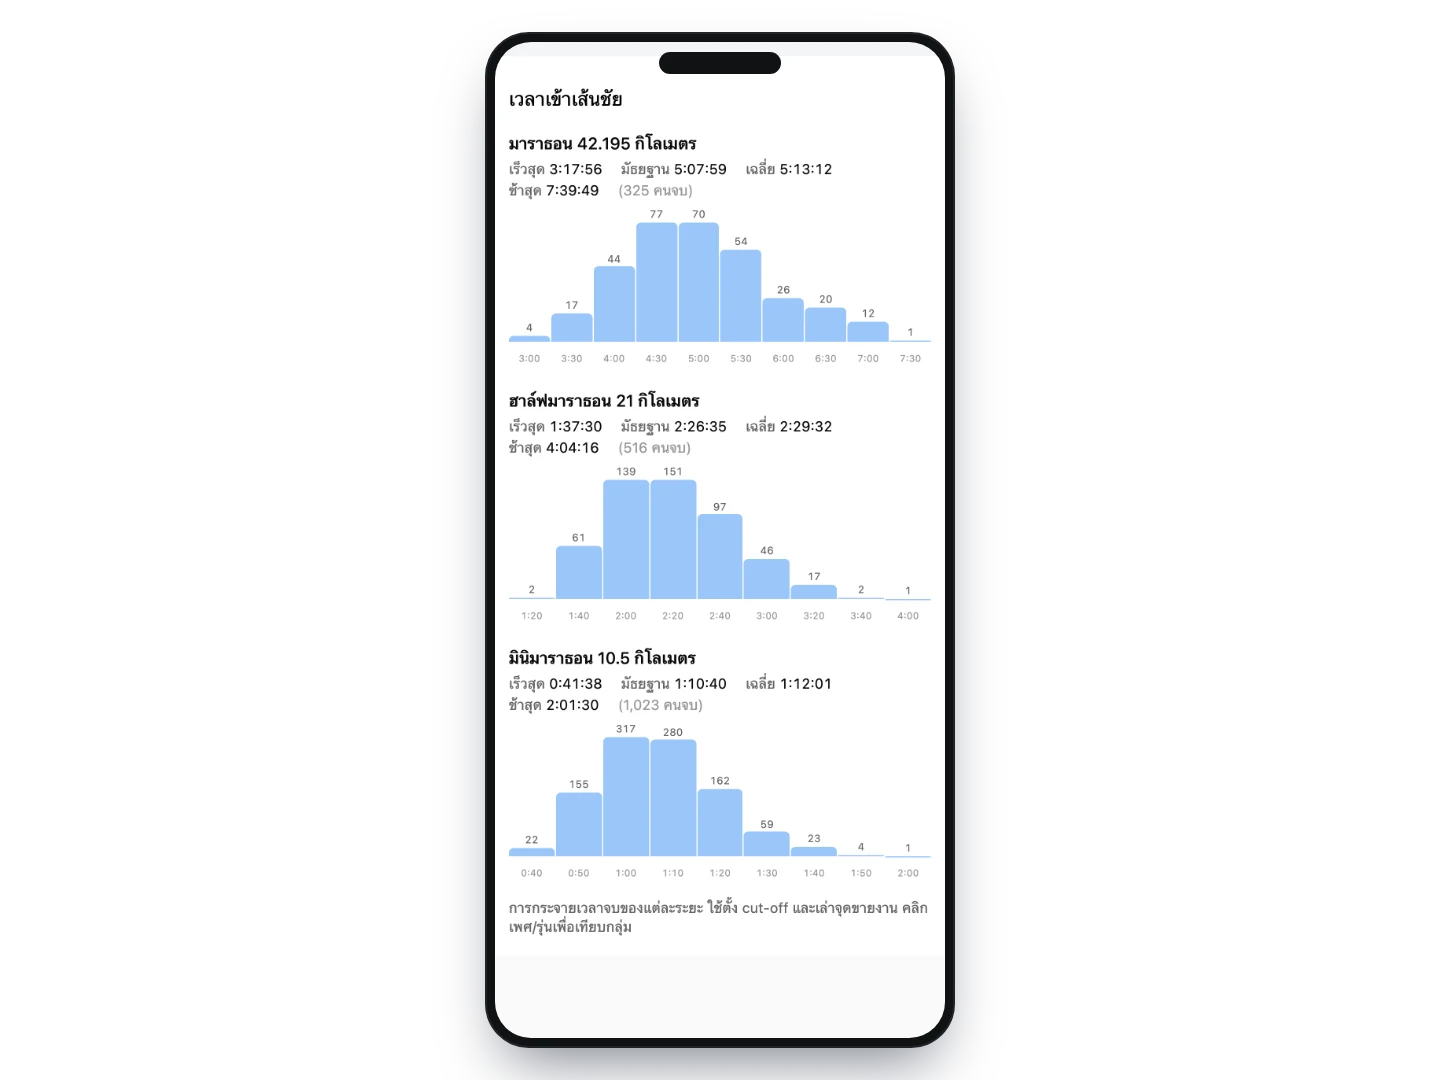
A graph by clock time showing how many crossed the line in each period. The peak is where the medal queue is longest, the water runs out fastest and the medical team works hardest — so next year you can position people and supplies around when runners actually arrive rather than when you expected them to.
- 4
Know how long each distance takes
Every distance has its fastest, slowest, median and average time, with a distribution showing where the field is bunched. These are the answers you need before the next edition: whether the road closure you requested was long enough, how many runners a given cut-off affects, and where the prize categories should be drawn.
- 5
Narrow to the group you care about in a couple of clicks
Pick a distance, age group or gender and every chart on the page follows. Questions like when women in the mini marathon finished, or how long the over-60s took, are answered in two clicks instead of a request for a file and a wait.
- 6
Everyone on the team can open it, including on a phone
Anyone with access to the event’s back office can open this page themselves, so the whole team works from the same numbers instead of passing several versions of a summary file round a chat group.
How organizers use it
Order next year’s stock against what really happened
Actual starters by distance and category is the base for how many medals, meals, drinks and which sizes to allow for — rather than estimating from entries, which is always higher than the number who turn up.
Staff the day around when it is actually busy
The finisher peak tells you when to reinforce the medal zone, the water points and first aid, and when people can be released to help elsewhere.
Set cut-offs and road closures you can defend
The slowest time per distance with its distribution is direct evidence for a road-closure application, and lets you say in advance how many runners a tighter cut-off would affect.
Build post-event reports for sponsors and venues
The mix of distances, age groups, gender and nationality among the people who actually ran is a picture of your participants for the post-event report — your event’s own data, not a platform total.
Compare against last year
requires a previous RunLah eventEvery year you have run with RunLah is in the same system, so you can open last year’s and see which distance runners moved to, which age groups grew, and whether the no-show rate came down.
Frequently asked questions
Where do these numbers come from — is there anything to fill in?
Nothing to fill in. Every figure is calculated from the results the timing system recorded. If a result is corrected later, the statistics move with it, so there is no separate file to keep in sync.
Can events timed by another provider use this?
Not currently, because the page reads per-runner times and statuses directly from RunLah’s timing system — which is why the statistics appear with nobody entering data. Events using our timing service get this page as part of it, with nothing extra to buy and nothing to connect.
How is this different from entrant statistics?
This page answers questions about the race: who ran, who finished, when they crossed the line and how long they took. Information about entrants — province, shirt size, how they heard about the event — belongs to the registration side, which has its own statistics page.
How are no-shows counted?
Anyone in the system with no recorded time at any timing point across the whole event counts as a no-show, kept separate from those who withdrew mid-race and do have times at some points. The two groups are used for different planning, so they are not combined.
Can we get a written summary rather than reading charts?
Tell the RunLah team and we will write an analysis from your event’s data and attach it to this page, where everyone on your team can read it. It is not produced automatically for every event, so please ask when you want one.
Can we take the raw data and work with it ourselves?
Yes — tell us what you intend to do with it and we will export per-runner results with splits as a file. It suits teams that already have someone who works with data.
Related services
Results & rankings
Results appear the moment a runner crosses the line, with splits and category rankings across every distance, plus an individual result page that can be shared and looked up long afterwards.
Ratings & surveys (NPS)
A thank-you email brings runners back to their results, their photos and a rating form, which becomes a score per category you can compare across distances and across years.
Daily summary by email
Every morning we email you a summary of entries and fees for your event, broken down by status and by distance — so you can follow how it is going daily without logging in.